We correct ourselves immediately, it is not just the Euroba but the entire Atlantic segment of the consumer society.
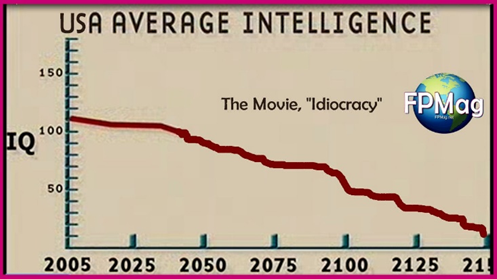
We could quote the movie “Idiocracy” and end the article that way but we won’t. Rather, let us start by explaining roughly what is meant by the mean.
The mean is a number that is not necessarily represented by an element of the statistical sample but is the center of the area of the distribution of that statistical sample (if the normal distribution is symmetrical then fashion, mean, and median correspond but we are not interested in delving into these aspects).
If we take a measuring instrument and ask a thousand people to measure an object as precisely as possible we will have a Gaussian distribution of the values of that measurement.
Some of the subjects will measure 13.73 once, 13.75, 13.69mm, others 15cm, a few 1371 bananas because they do not know the meaning of the comma and units of measurement. Others but few still 13.72+/-0.015 @ 1σ. The latter made multiple measurements with the given instrument, found the mean value (µ) of the measurements and estimated the accuracy with a confidence interval (1σ).
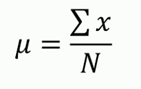
Where N is the total number of measurements.
By making a statistic of the measured values and graphing them we will probably obtain a Gaussian:
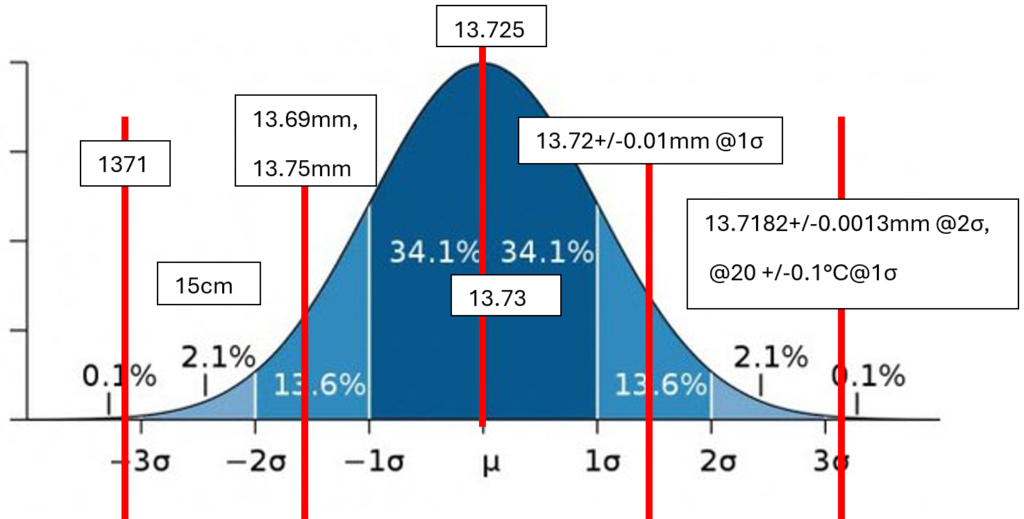
In the center we see 13.725mm, which is the average µ value calculated according to the formula above (we are absolutely shooting at random, it is just an example). But maybe no one has measured that number directly.
On the left are the values of people who don’t know how to use the given instrument and shoot practically random numbers, here we assume, perhaps optimistically, that they are a reasonably small number. The average of the given numbers will represent a mean value of the measurement while on the right side of the curve will appear much more accurate but also less frequent results since their complexity probably requires at least a PhD in physics.
What does this tell us? That the value given by average intelligent people will be correct to the extent that great accuracy is not needed, but it also tells us that if you choose the value democratically, you will get a mediocre result, at least not of scientific relevance.
Moreover, the curve gives us a cross-section of the intelligence (in one area) of people. Here we have drawn the curve symmetrically…but the stupid may be many more than the intelligent…
Now imagine that really that Gaussian is a representation of the IQ of a state or continent, Euroba for example. The average IQ value is by definition 100, on the left are the dumb people, on the right are the bright ones. We are not defining intelligence here; that is not the point. Then let’s say there is no more natural selection (= you’re stupid, you eat a muscaria amanita, you die and you don’t reproduce: it could happen to 90% of the Milanese if put outside their natural environment) and let’s also say that the highest value of Euroba culture is to preserve anyone’s life as long as possible. How does Euroba put in place the systems to enforce its value? By legislating! i.e., by inserting regulations that force the design of increasingly safe systems: foolproof.
Well, let’s draw a vertical line at IQ=85, representing a standard or law enacted by Euroba that must be adhered to (to reduce fire risk one must design a fire protection system, then every year calibrate all fire protection systems, then every year all doors must be recalibrated, then the next year the materials in the fire doors are no longer up to standard, so all doors must be changed…and so on). That line will also be the watershed between everyone with an IQ>85 for whom enforcement of that standard will be stupid and those with an IQ≤85 for whom that standard will make sense.
In the beginning, safety regulations, for example, might have also made sense, i.e., to apply some basic principle that costs relatively little (the fire-fighting system, done once, that’s for 30 years) but has immense benefits, should the catastrophic eventuality happen. But this has currently gotten out of hand. We believe that in the long run the application of downward rules of intelligence leads to shifting the absolute IQ curve toward lower IQs. The multiplier effect is that the stupid survive and reproduce on average more than the intelligent (and here we cite Idiocracy).
Moreover, the intelligent, having to submit to idiotic rules, will find themselves wasting an infinite amount of time interfacing with idiots about idiotic rules (thermodynamic noise and see here: Sgaragac and thermodynamic bureaucracy). To waste an intelligent person’s time is correspondingly to deprive him of growing experience and knowledge therefore, de facto, is to make him dumber.
The dematerialization due to the digitization of everything accelerates dumbing down precisely because the insight of action that compelled the stupid of thirty years ago to react faster (out of self-preservation instinct) is taken away. Meager consolation but today…today one waits, one waits for the process to have reached completion, for the files to be uploaded to the cloud. One foolishly waits while watching the electronic monitor instructing us on the next action to take according to preset drop-down menus (see: Option and lack of option).
Whether or not there are scientific studies to prove the epidemic of overall dumbing down is irrelevant, if you don’t see it yourself then you are stupid. Sorry but you are part of the left side of the Gaussian.